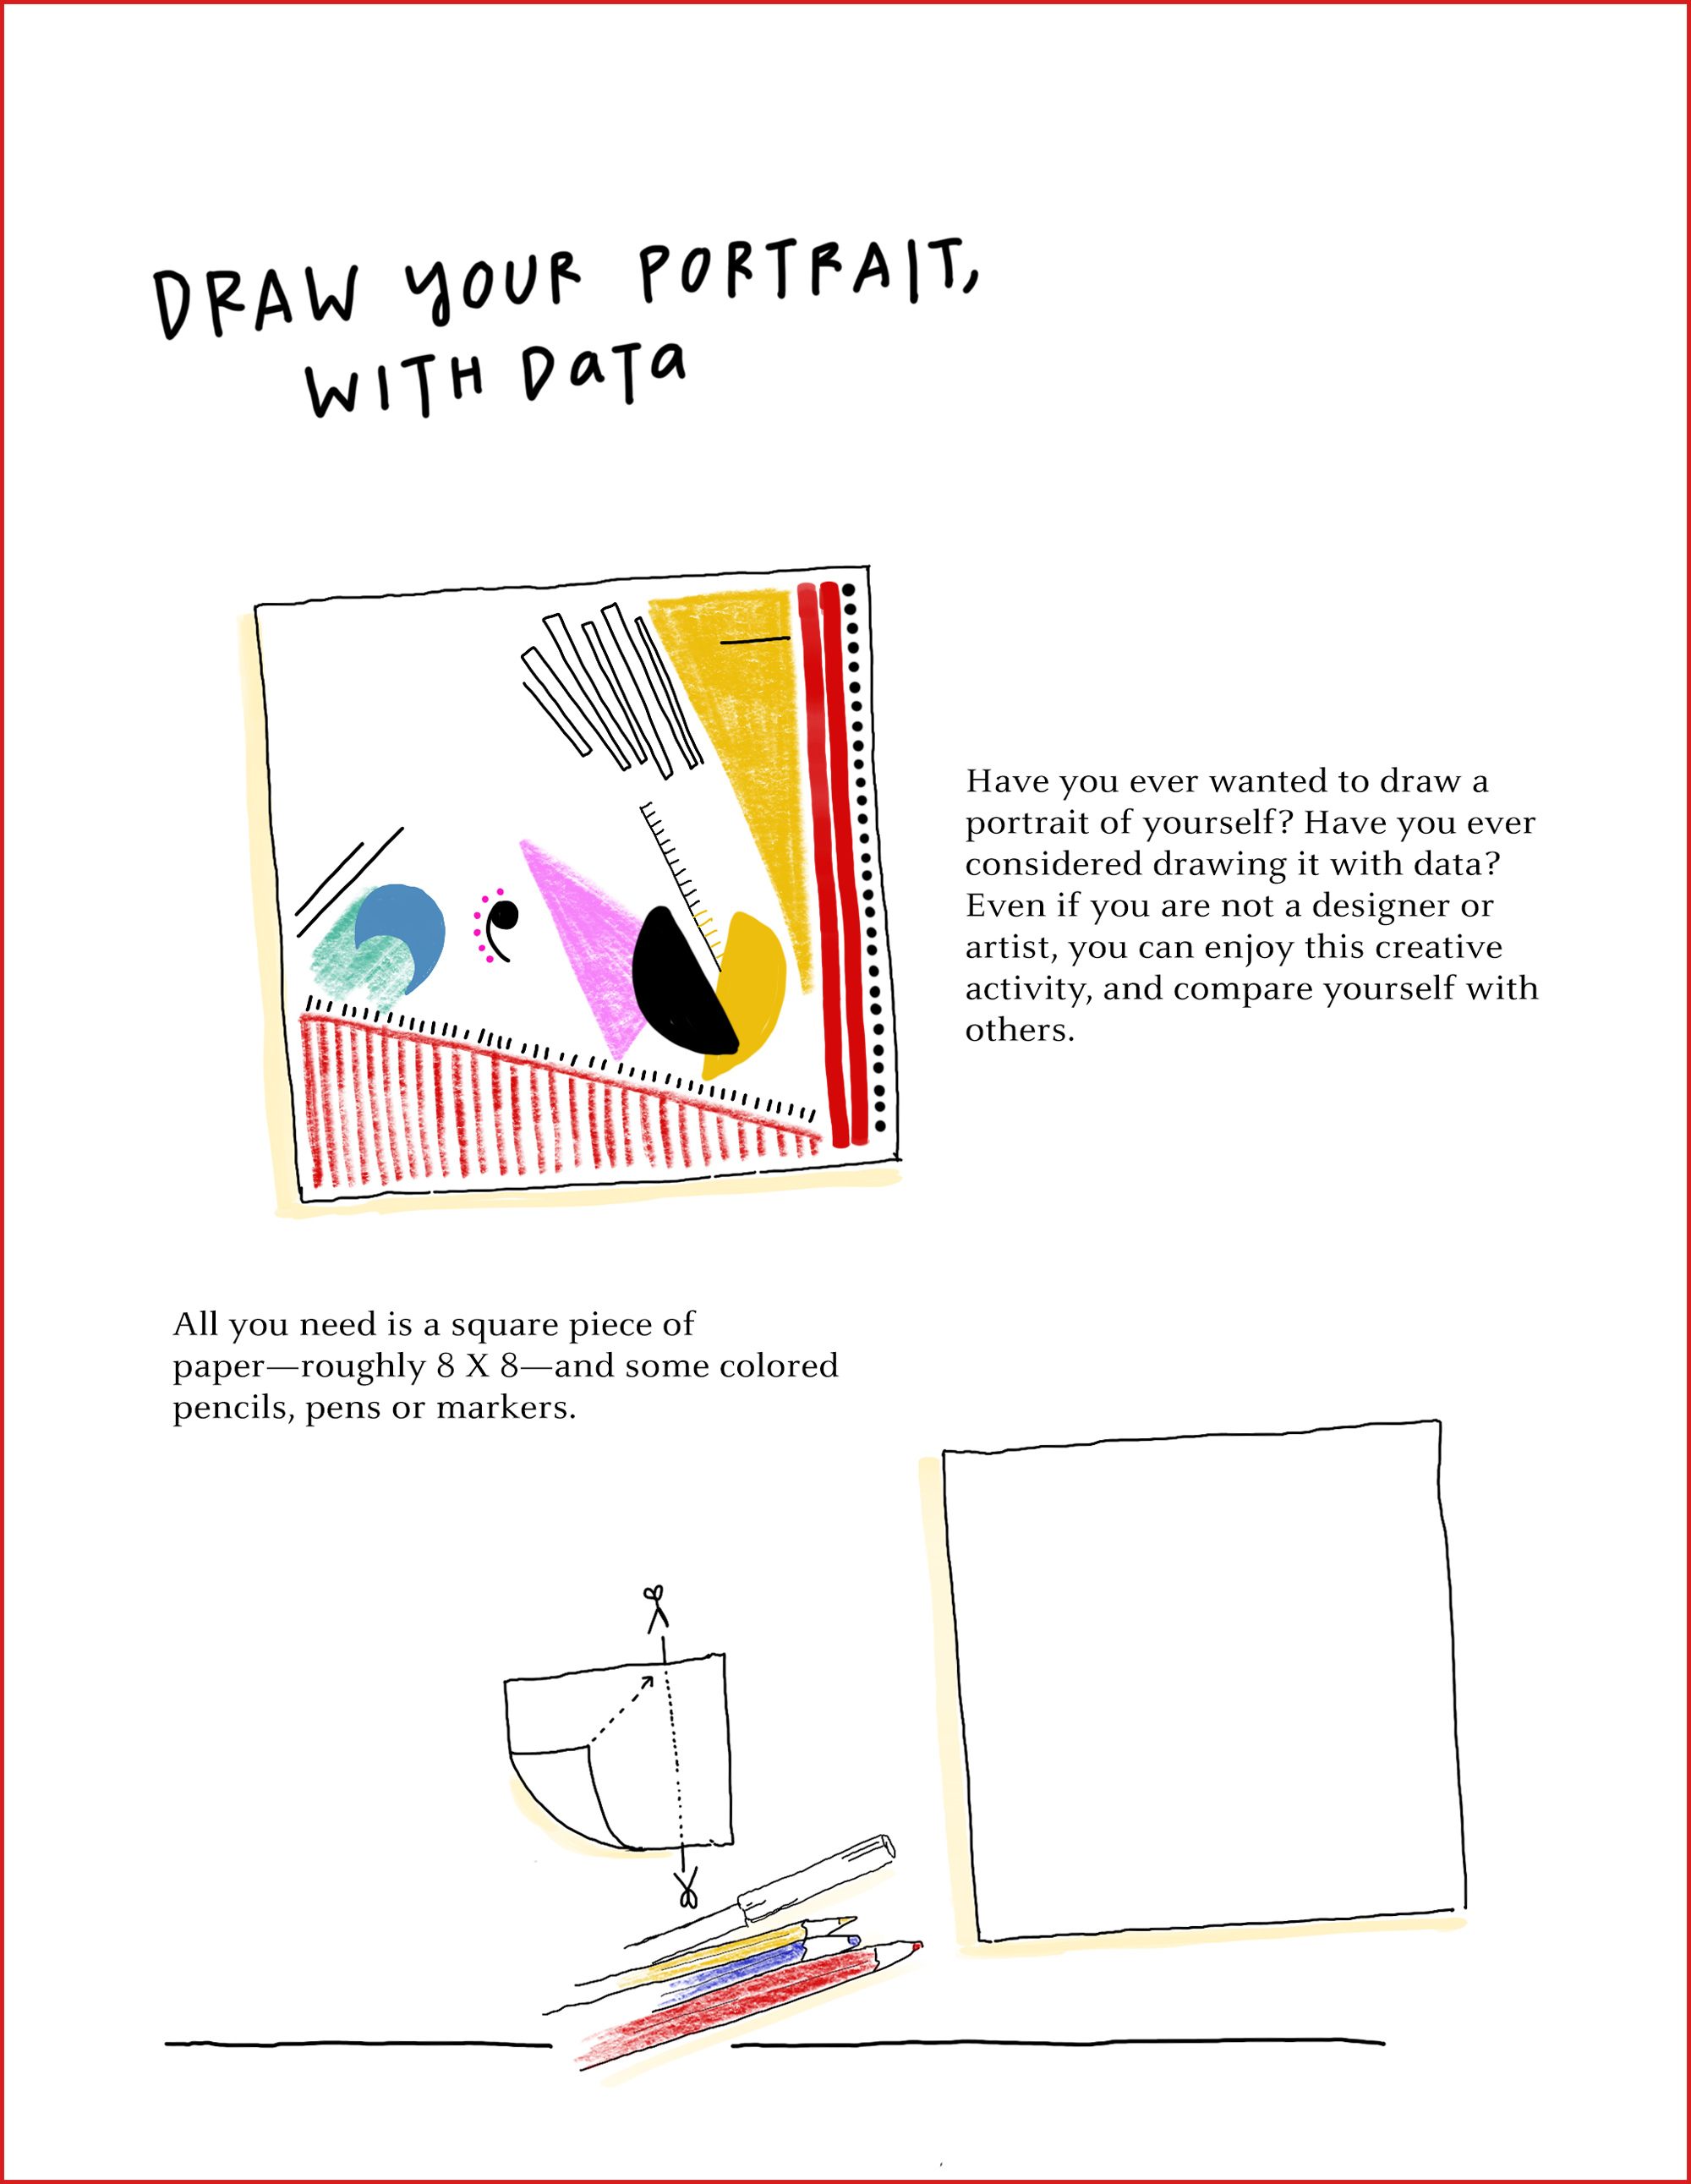
"Designer Giorgia Lupi wants to change the way we think about data — far from being cold facts and numbers, it can be warm and often flawed. Follow her step-by-step instructions to generate a data-driven perspective on the person you know best: you."
The following project will help you understand how data can be used to create visualizations that help others understand it more easily. Many examples exist in our world, and many careers are increasingly relying on these types of visualizations to make sense of the vast amounts of data that are generated by almost everything we do. From our shopping and personal habits, to the large amounts of data created by almost every field of study, it is sometimes easy to become "lost" in the numbers and stacks of random tables that the data is organized into.
"Remember that data, like us, is imperfect. “It’s time to leave behind any presumption of absolute control and universal truth,” says Lupi. Since we get our data from humans; it’s riddled with human error and tainted by biases. We should embrace these imperfections, just as we embrace imperfections in ourselves and others. These portraits are only the start of forming a new relationship with your data. Once you feel more connected to it, you’ll see it differently. We must treat data “as the beginning of the conversation,” Lupi says, “and not the end.”" - IDEAS.TED.COM (article references above)
Please spend some time tomorrow (ASYNCH WEDNESDAY) watching the following video about this project:
Assignment #1 (❗️): Students will create an original art piece using skills and tools (SKETCH.IO) from the last lesson. Students will open the following Data Selfie Digital Art Project Google Slides (Click Here) and follow all the directions to complete their personal data portrait. Once completed students will need to upload their final project to their Google Drive and SHARE it with Mr. S (harvey.scribner@techfreire.org) for credit. Students should also post this project to the main page of their Student Digital Portfolio (Quarter 1 Project).

Learning Objectives
After this lesson students will be able to:
- define digital art
- discuss the history of digital art
- explain how digital art is used today
- create some basic examples of digital art
Curriculum Standards
- CCSS.ELA-Literacy.RH.11-12.4
Determine the meaning of words and phrases as they are used in a text, including analyzing how an author uses and refines the meaning of a key term over the course of a text (e.g., how Madison defines faction in Federalist No. 10).
- CCSS.ELA-Literacy.RH.11-12.5
Analyze in detail how a complex primary source is structured, including how key sentences, paragraphs, and larger portions of the text contribute to the whole.
- CCSS.ELA-Literacy.RH.11-12.7
Integrate and evaluate multiple sources of information presented in diverse formats and media (e.g., visually, quantitatively, as well as in words) in order to address a question or solve a problem.
Materials
- Computers with Internet Access and Sketchpad.IO or similar application
- A photo of digital art
REFERENCES
https://study.com/academy/lesson/digital-art-lesson-plan.html
https://sites.google.com/a/greenvilleschools.us/millerdigitalarts/art-1
https://www.ted.com/talks/giorgia_lupi_how_we_can_find_ourselves_in_data
https://ideas.ted.com/how-to-draw-your-own-selfie-using-your-personal-data/


No comments:
Post a Comment
Note: Only a member of this blog may post a comment.